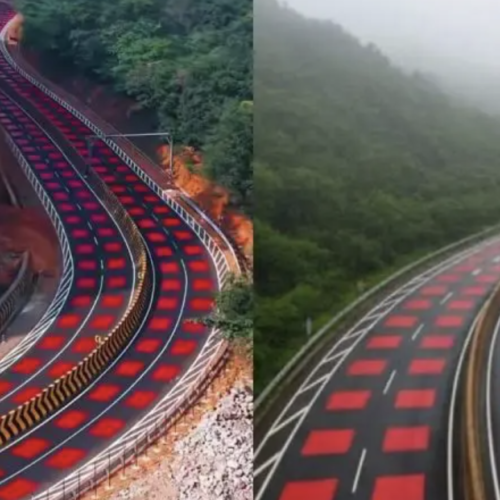
If you drive through Madhya Pradesh’s Veerangana Durgavati Tiger Reserve on National Highway 45, the road beneath your tyres suddenly changes colour.
For two kilometres, the grey asphalt becomes a continuous bright red surface, raised just five millimetres above the rest of the carriageway, with a checkered texture layered on top to discourage overspeeding. There is no signage screaming “slow down.” There is no speed camera waiting to issue a fine. There is just a road that looks and feels different from every other road you have driven on, for exactly the stretch where it matters most.
This stretch of forest is home to deer, jackals, sambar, and tigers, and the highway running through it had recorded numerous animal fatalities before the intervention. NHAI’s own figures claim the red surface naturally brings vehicle speeds below 40 km/h, achieved entirely through colour, texture, and a barely perceptible rise in the road surface, with no barrier the driver has to physically negotiate.
This is India’s first “table-top red marking,” rolled out by the National Highways Authority of India in December 2025 as part of an 11.96-kilometre highway project cutting through protected tiger habitat. The colour is not decorative. It is based on a surprisingly simple idea: sometimes the safest road isn’t the one that tells drivers what to do. It’s the one that quietly changes what they feel like doing.
Why Red, Specifically
Red is not an arbitrary design choice. It is the single most extensively studied colour in road safety research, and the evidence is remarkably consistent across countries.
A 2025 ScienceDirect study using a driving simulator near a school crossing in Madrid compared four traffic-calming road markings: a green line, dragon’s teeth patterns, a broken edge line, and a red painted median. The red median consistently outperformed the others, particularly for drivers who would otherwise be travelling fastest. The researchers traced this to existing road signage conventions: red is already culturally and visually encoded as danger, which means a red surface requires no learning curve. The driver’s brain already knows what red means before they consciously register why the road has changed colour.
A separate 2025 driving simulator study published in the journal Drones and Autonomous Vehicles tested red transverse bands specifically on curved rural roads. Red coloured bands produced the strongest speed reduction on the largest-radius curves, exactly the kind of long, sweeping bends where drivers feel safest maintaining speed and are statistically most likely to be wrong.
Did you know? UK trials found that surface colouring alone, with no physical barrier, cut speeds at village entry points by up to 8 mph. Violations of the speed limit fell from 50% to 10%, and the effect held over time.
Red surface markings have been deployed at school crossings in France, hospital approaches in the Netherlands, and village entry points across the UK. India’s application to a wildlife corridor is novel in context, not in principle.
The Road Is Talking to the Driver
Most drivers believe they choose their speed. Road designers know the road often chooses it for them.
Every road sends subtle signals. Wide lanes invite speed. Narrow lanes encourage caution. Long, straight stretches feel safe to accelerate on. Trees close to the carriageway create a sense of enclosure that naturally slows drivers down. Surface texture, road markings, lighting, and even colour all shape what feels like the “right” speed, often without the driver consciously noticing.
Traffic engineers call these self-explaining roads: roads designed to communicate how they should be driven, without relying entirely on signs, speed limits, or enforcement.
The red stretch through Veerangana Durgavati Tiger Reserve is an example of this philosophy. It doesn’t physically force drivers to slow down. Instead, it changes how the road feels. The colour signals caution. The textured, slightly raised surface creates subtle visual and tactile cues that make maintaining highway speed feel less natural.
It is a different way of thinking about road safety: instead of punishing unsafe behaviour after it happens, the road itself nudges drivers toward making safer decisions in the first place.
What Made NHAI Choose This Stretch
The 2-kilometre red zone on NH-45 was not selected at random. NHAI identified it specifically because it combines two danger factors: challenging road geometry and a known wildlife movement corridor. The project pairs the red surface with 25 dedicated animal underpasses, continuous 8-foot fencing on both sides of the highway designed specifically to guide animals toward those underpasses rather than onto the carriageway, solar lighting at bridges and junctions, and bright white shoulder lines to stop vehicles drifting onto unpaved edges.
The fencing does the heavy lifting on wildlife safety. It physically prevents animals from stepping onto the carriageway and funnels them toward the underpasses instead. The red surface’s job is narrower and more specific: it works on the driver, not the animal. NHAI’s own framing is explicit that the slightly raised surface generates mild tactile and audible feedback intended to bring speeds down naturally, without the harsh braking that conventional rumble strips can trigger.
This distinction matters. A rumble strip forces a reaction through physical discomfort. A red surface attempts something subtler: changing the driver’s perception of the road itself before they have consciously decided to slow down.
Did you know? The U.S. Federal Highway Administration estimates one to two million wildlife-vehicle collisions occur annually in America alone. Inside India’s own tiger reserves, including Mudumalai and Nagarhole, studies have found vehicle speed to be the single largest cause of wildlife deaths on forest highways.
India has experimented with design-based interventions before: the 3D zebra crossings in Rajkot and Surat, rumble strips on national highways, and raised intersections in some urban areas. The red road is different in one important respect: it is the first to combine colour, texture, and elevation change specifically to exploit driver psychology rather than just create a physical obstacle.
It Is About Humans, Not Animals
It is tempting to read the red road purely as a conservation story. It is not only that.
Every highway that cuts through a forest or wildlife corridor in India also carries human traffic, and the same speed that endangers a tiger or a sambar deer endangers every two-wheeler rider, pedestrian, and oncoming vehicle on that stretch. The World Health Organization’s 2023 data, cited in the same body of traffic-calming research, found that a pedestrian’s risk of death rises by 4.5 times when impact speed increases from 50 km/h to 65 km/h. The physics of speed do not distinguish between a collision with a leopard and a collision with a person.
This is precisely why the psychological traffic-calming literature matters far beyond wildlife corridors. If a road surface change can reliably reduce speed without a single speed camera or police checkpoint, the same principle applies to school zones, market roads, hospital approaches, and the thousands of accident-prone stretches across India’s highway network that have no fencing, no underpasses, and no wildlife to justify the intervention, only people.
India’s approach to speed management has historically leaned almost entirely on enforcement: speed cameras, fines, and challans issued after the fact. The results are well documented: India’s speed camera network remains sparse, enforcement is inconsistent, and fines low enough that compliance is rational only when detection is likely. A design-first approach sidesteps this entire problem. It works whether or not anyone is watching.
The red road experiment is a rare instance of India testing a design-first approach, one that tries to change behaviour before the violation happens rather than penalising it afterward.
That makes it exactly the kind of intervention worth watching closely, not just admiring.
Does It Actually Work?
A road that changes colour to change behaviour is a compelling idea. Whether it actually works is a separate question, and it is the one we find more interesting.
Every traffic-calming intervention eventually faces the same test: does the effect last, or does it fade as drivers become familiar with the road? Research on visual traffic-calming measures consistently shows a habituation risk.
The UK experience with red surfacing at village entries showed the effect held over an 18-month observation period, attributed partly to the tactile component maintaining novelty even after the visual element became familiar. NHAI’s design appears to have learned from this: the checkered texture and five-millimetre raise are precisely the elements that keep the surface registering as physically different, not just visually.
A driver’s first few passes through a red zone produce the strongest reaction. Repeated exposure over months can erode that response unless the visual cue is paired with something that continues to register as genuinely different, like the tactile feedback NHAI has built into this specific surface.
This is exactly the kind of question behavioural driving data is built to answer. Speed profiles through the red zone, measured before and after the intervention and tracked over months rather than days, would show whether this is a genuine behaviour change or a temporary novelty effect. Braking patterns on approach would reveal whether drivers are responding early and smoothly, the outcome NHAI is hoping for, or late and sharply, which would suggest the colour is not being noticed early enough to matter.
The Road Is Talking to the Driver
Most drivers believe they choose their speed. Road designers know the road often chooses it for them.
Every road sends subtle signals. Wide lanes invite speed. Narrow lanes encourage caution. Long, straight stretches feel safe to accelerate on. Trees close to the carriageway create a sense of enclosure that naturally slows drivers down. Surface texture, road markings, lighting, and even colour all shape what feels like the “right” speed, often without the driver consciously noticing.
Traffic engineers call these self-explaining roads: roads designed to communicate how they should be driven, without relying entirely on signs, speed limits, or enforcement.
The red stretch through Veerangana Durgavati Tiger Reserve is an example of this philosophy. It doesn’t physically force drivers to slow down. Instead, it changes how the road feels. The colour signals caution. The textured, slightly raised surface creates subtle visual and tactile cues that make maintaining highway speed feel less natural.
It is a different way of thinking about road safety: instead of punishing unsafe behaviour after it happens, the road itself nudges drivers toward making safer decisions in the first place.
At Attento, we track exactly the kind of behavioural signatures this intervention is trying to change: approach speeds, braking initiation points, speed variance through transitional zones. A red surface intervention like the one on NH-45 produces a testable prediction: that speed profiles through the zone should drop on first exposure and either hold or decay over subsequent months. Whether they hold depends on whether the tactile feedback continues to register, or whether the visual novelty fades into background.
This is not a hypothetical measurement problem. It is a solvable one. The success of this intervention shouldn’t be judged by how innovative it looks, but by how drivers behave six months from now. Roads can be designed to influence behaviour. Behavioural data tells us whether they actually did.
India builds a great deal of road safety infrastructure on assumption and intention. Very little of it is validated against what drivers actually do once the cameras and the press releases are gone. A red road is a genuinely interesting idea. Whether it works is a question only behavioural data can answer.