India’s road safety crisis affects over 500,000 people annually — but the risk isn’t spread evenly across the country. In fact, some of the most accident-prone places aren’t the ones with the most traffic. And some of the safest roads are in India’s busiest cities.
That’s what makes the Ministry of Road Transport and Highways’ (MoRTH) 2022 Road Accidents in India report so revealing. The data challenges conventional assumptions — and uncovers real opportunities for smarter, safer driving practices at the local level.
Understanding these patterns is crucial for developing effective safe driving practices tailored to real-world risk.
Road Safety by State: Where Accident Risk Concentrates
Top 5 States by Total Accidents (2022)
- Tamil Nadu: 64,105 accidents
- Madhya Pradesh: 48,206
- Maharashtra: 39,493
- Karnataka: 39,200
- Kerala: 33,051
Bottom 5 States and UTs by Total Accidents
- Nagaland: 53 accidents
- Lakshadweep: 0 (no data reported)
- Mizoram: 144
- Sikkim: 252
- Dadra & Nagar Haveli and Daman & Diu: 150
While these low numbers reflect smaller populations and road networks, they also highlight vastly different risk environments — in terrain, traffic behavior, and emergency response capacity.
Safe Driving Practices: Why Per-Capita Risk Matters More
Raw accident numbers tell part of the story. But to understand where the most urgent safe driving practices are needed, we must look at accident rates relative to population size.
| City | Population (Est. 2022) | Accidents | Fatalities | Accidents per 1L people | Fatalities per 1L people |
|---|---|---|---|---|---|
| Jaipur | 4 million | 4,076 | 873 | 101.9 | 21.8 |
| Lucknow | 4.1 million | 2,423 | 857 | 59.1 | 20.9 |
| Chennai | 11 million | 5,034 | 1,335 | 45.7 | 12.1 |
| Bengaluru | 13 million | 4,753 | 755 | 36.5 | 5.8 |
| Hyderabad | 10.5 million | 3,585 | 576 | 34.1 | 5.5 |
| Delhi | 32 million | 5,477 | 1,461 | 17.1 | 4.6 |
| Mumbai | 21 million | 2,845 | 350 | 13.5 | 1.7 |
Surprising reality: Drivers in Jaipur face 6–7x higher accident risk than those in Mumbai — even though Mumbai has more traffic, denser roads, and a higher vehicle count.
These per-capita rates reveal where road safety practices matter most urgently — and where public awareness and enforcement need to shift.
Fatality Rates by State: Where Crashes Are Deadliest
Another overlooked metric is fatalities per accident. It offers insight into crash severity, speed of response, and emergency care quality.
| State | Population (Est.) | Accidents | Fatalities | Fatality Rate (%) | Accidents per 1L people |
|---|---|---|---|---|---|
| Tamil Nadu | 78 million | 64,105 | 15,384 | 24.0% | 82.2 |
| Maharashtra | 126 million | 39,493 | 15,224 | 38.5% | 31.3 |
| Uttar Pradesh | 237 million | 37,965 | 22,595 | 59.5% | 16.0 |
| Kerala | 36 million | 33,051 | 12,351 | 37.3% | 91.8 |
| Sikkim | 0.7 million | 252 | 112 | 44.4% | 36.0 |
Key insight: Kerala and Tamil Nadu report higher crash counts but lower fatality rates — likely due to better trauma care and emergency response. Meanwhile, Uttar Pradesh has fewer crashes per capita, but the deadliest roads in India.
What the Data Tells Us — and What It Doesn’t
- More vehicles ≠ more risk: Cities like Mumbai and Delhi have heavy traffic but fewer fatalities per capita.
- Better roads can increase danger: High-speed corridors and wide highways invite speeding — especially in Tier 2 cities where enforcement is weaker.
- Emergency infrastructure matters: Lower fatality rates in TN/Kerala suggest strong post-crash response matters more than traffic volume alone.
- Behavior drives outcomes: Speeding, phone use, and night driving remain the top causes in both urban and rural crashes.
This Is Why Safe Driving Practices Must Evolve by Region
The variation in road risk proves one thing: blanket awareness campaigns won’t work. Jaipur drivers need different safe driving practices than Mumbai commuters. Kerala’s drivers face different risks than those in Uttar Pradesh.
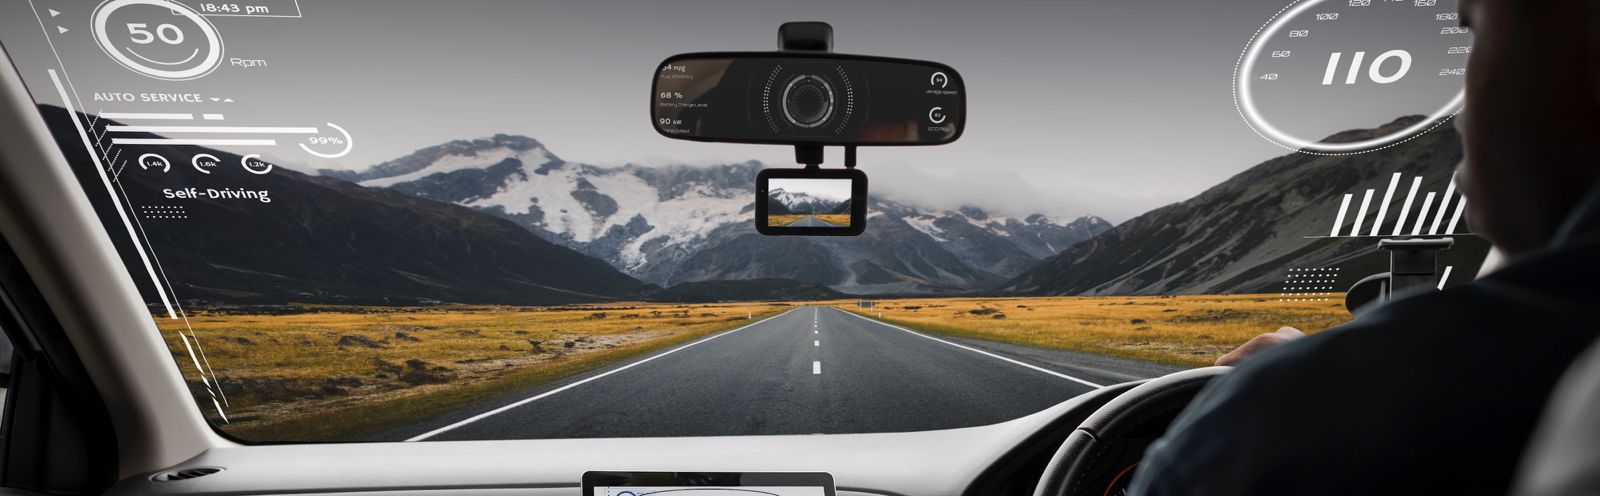
That’s where Attento Technologies comes in. Our mobile-first platform doesn’t just track behavior — it adapts to context. Here’s how:
- Identifies risk by location and time: Attento uses smartphone sensors and GPS to detect risky behaviors in high-risk zones — like night driving in rural highways or overspeeding on expressways.
- Builds better habits: Drivers get a daily safety score and an overall AttentoScore — like a credit score for road behavior.
- Rewards safety: Safe drivers earn Attento Miles — redeemable for fuel, food, or services.
- Creates positive peer pressure: Safety streaks, badges, and leaderboards encourage friendly competition for consistent good driving.
This data-driven approach to road safety is exactly what regional variation demands — personalized, adaptive, and rewarding.
Conclusion: Smarter Driving Begins With Smarter Insights
Ready to experience personalized road safety? Join Attento’s invite-only beta and discover how real-time insights can transform your driving habits. Because the future of road safety isn’t about rigid rules, it’s about smart, adaptive behavior tailored to where and how you drive.